FTSE 100: Is the UK stock market flat?
Following my article last month on Japan’s stock market, I wanted to take a look at another foreign market: the United Kingdom, and more specifically, the FTSE 100.
What is the FTSE 100?
The UK stock market is currently ranked 4th in the world by total market capitalization, trailing only the United States, China, and Japan. The Financial Times Stock Exchange 100 Index, or FTSE 100, is one of the leading indicators of the UK stock market. The FTSE 100 is a cap-weighted index of the largest 100 companies in the UK, with some qualifiers. In this regard, the FTSE 100 is very similar to the S&P 500 for US stocks.
Further information about the FTSE 100, such as recent returns and constituent companies, can be found on the FTSE website. Many of these large UK companies are household names, even outside the UK, with constituents such as Barclays, HSBC, Shell, and Rolls-Royce.
Interesting, some have argued that the FTSE 100 is not a great indicator of the UK economy, because the FTSE is very top-heavy, and the large companies at the top are heavily multinational. For example, as of 2021, the top 5 constituents of the FTSE 100 (AstraZeneca, Shell, Unilever, HSBC, and Diageo) make up over 27% of the index, and all of these companies derive far more of their revenue from outside the UK than from within the UK. Therefore, the FTSE tends to be affected more by the exchange rates of the British pound (GBP) than by the economy of the UK itself. These factors are not unique to the FTSE 100 and affect all cap-weighted stock indices and multinational companies to some degree. By comparison, the top 5 constituents of the S&P 500 as of 2021 (Apple, Microsoft, Amazon, Google, and Tesla) make up about 23% of the S&P 500.
There are multiple other FTSE indices for the UK market, including the FTSE 250 and the FTSE Small Cap, etc. This is similar to how the S&P also has the S&P 600, S&P 1500, and other indices. Neither the FTSE 100 nor the S&P 500 represent the entirety of the UK or the US stock market, respectively. However, the FTSE 100 represents about 80% of the total UK market by market cap, and the S&P 500 represents a similar proportion of the US stock market.
Performance
Despite the top heavy, multinational nature of the FTSE 100, it remains the most widely followed benchmark of the UK stock market. How has the FTSE 100 performed over time? The FTSE 100 index was originally launched in 1984 with a starting value set at 1,000. Following a significant bull market in the 1980s and 1990s, the index values increased multiple-fold from 1984 to 1999, and it closed at an all-time high of 6930.20 at the end of 1999.

FTSE 100 index’s bull run from inception to 1999.
Of course, as 1999 turned into the new millennium, investors all around the world were rocked by two devastating market collapses: the dot-com bubble from 2000 - 2002 and the global financial crisis from 2007 - 2009. The UK market was no exception.
Here’s how the FTSE has fared so far in the 21st century:
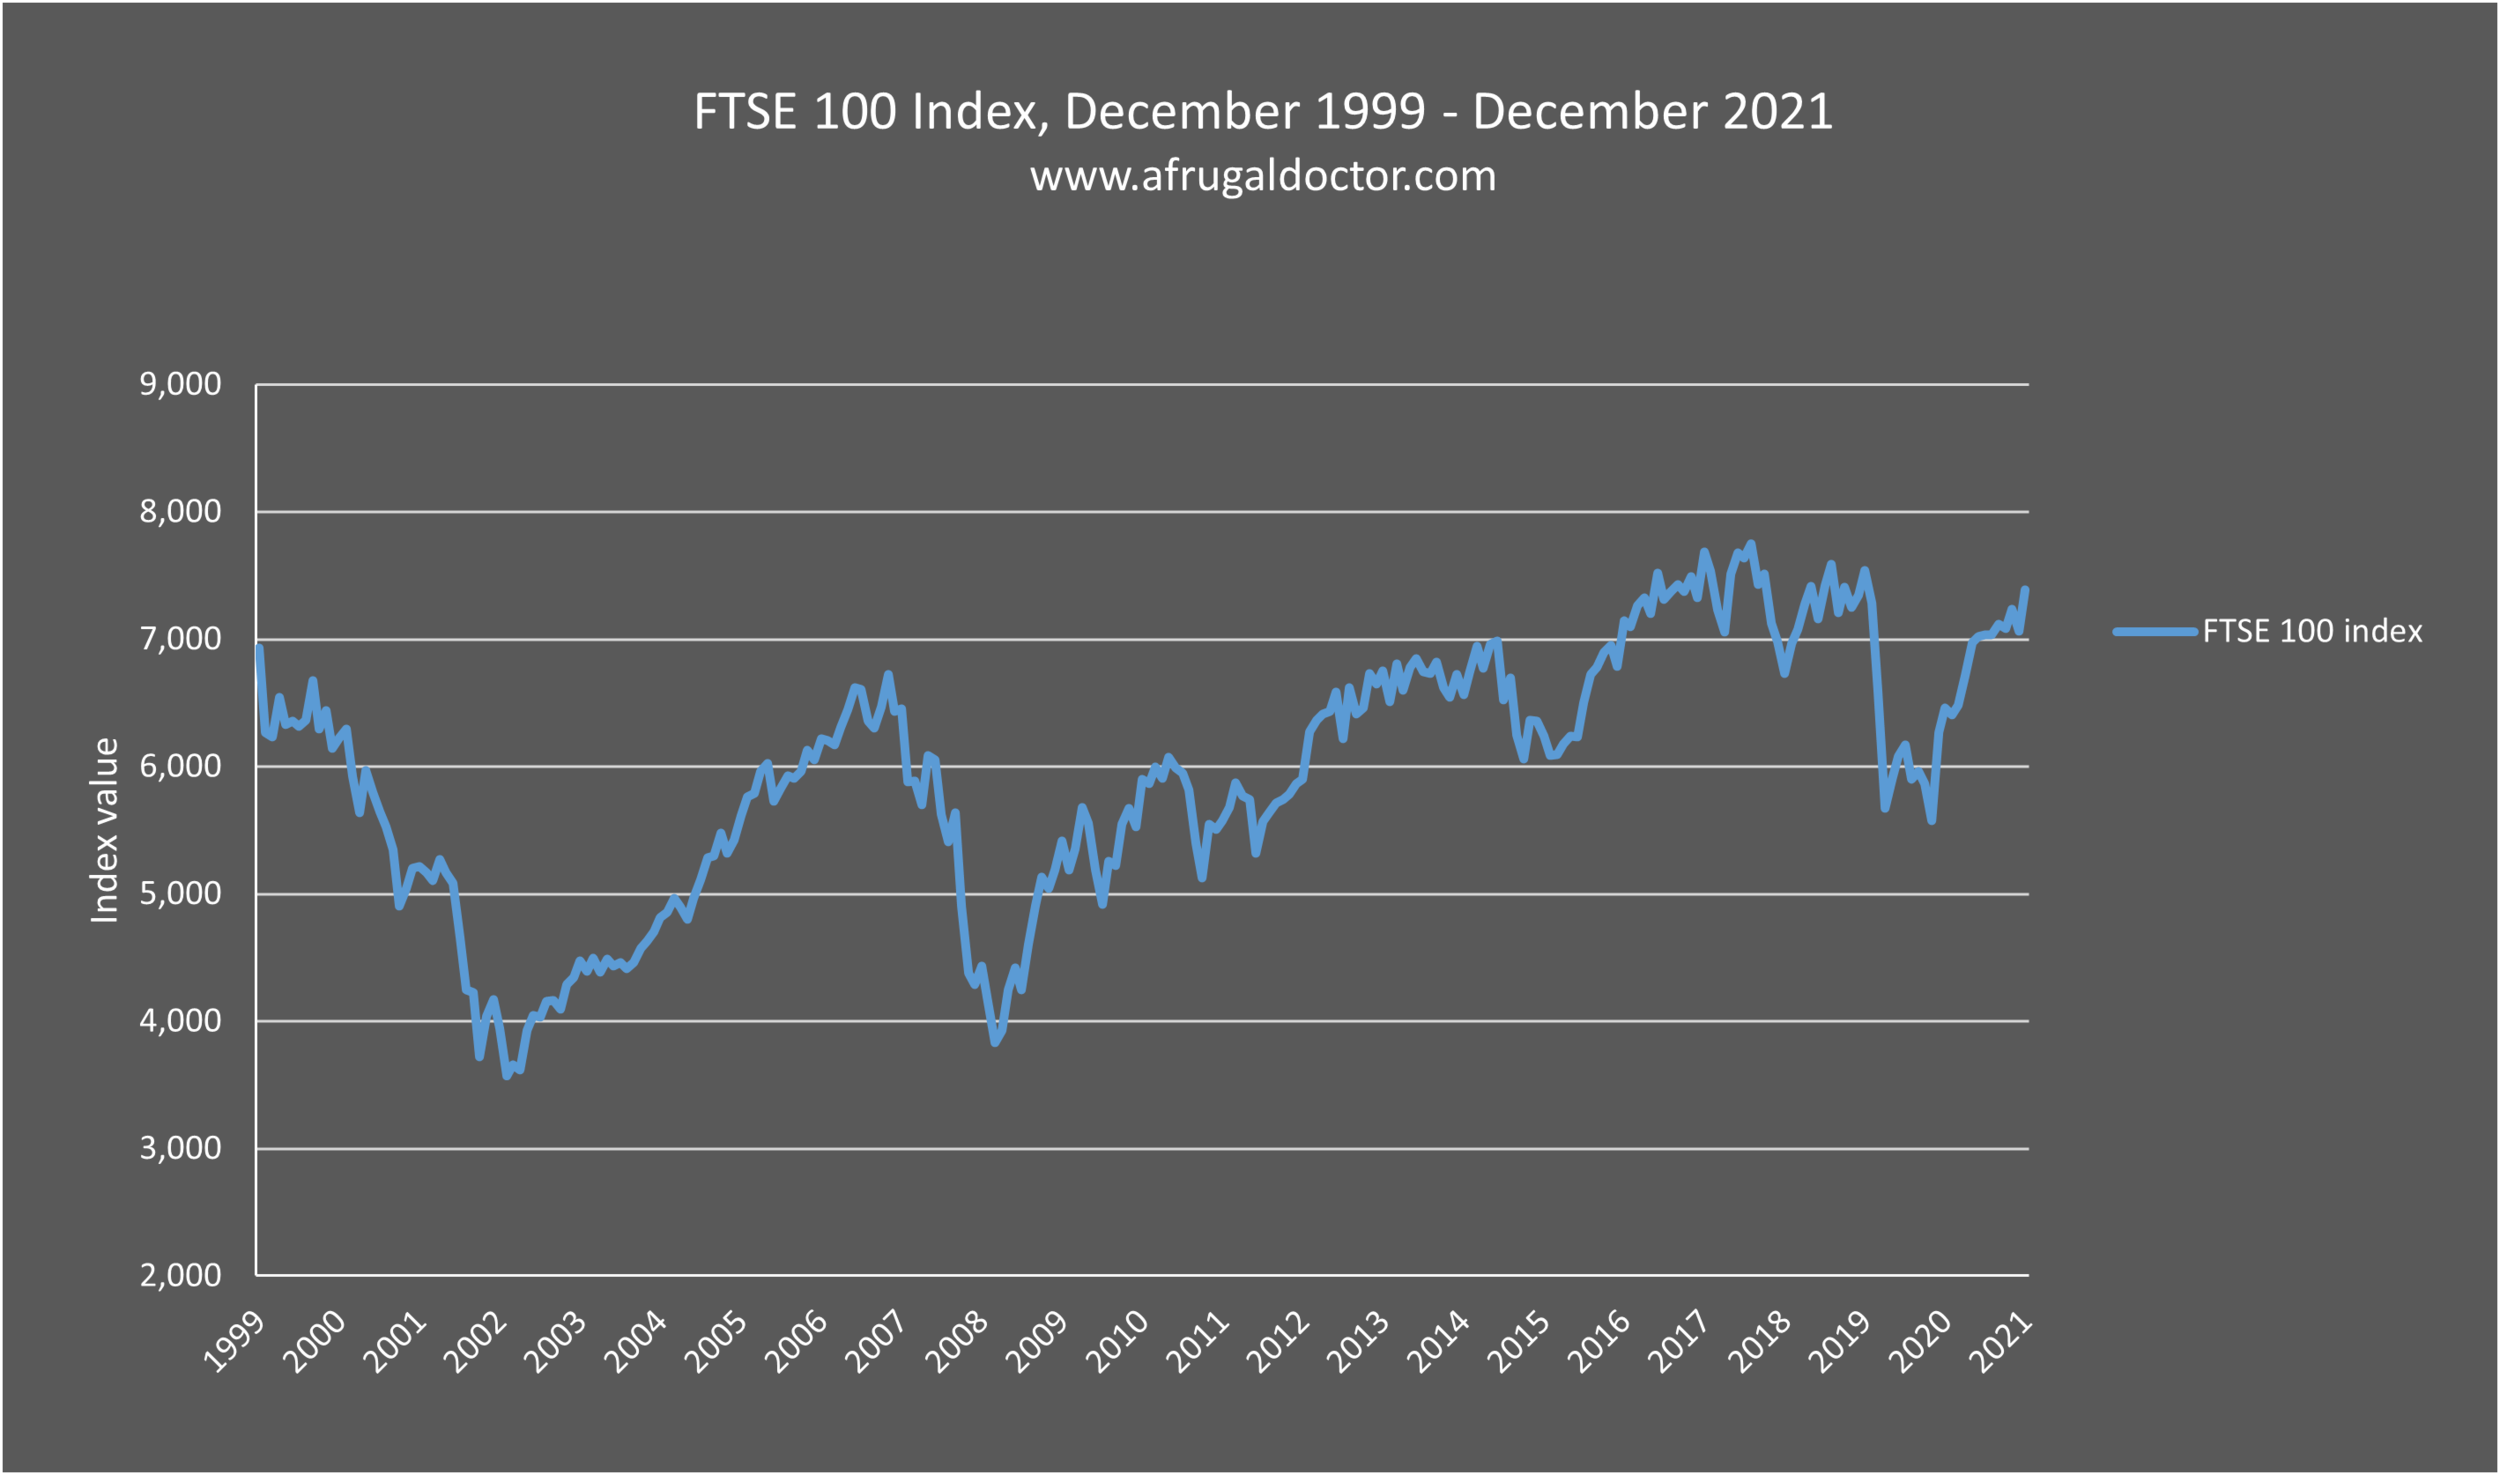
FTSE 100 index since the dot-com bubble.
Unfortunately, as we can see, over the next 20 years the FTSE 100 index would experience significant volatility, but overall remain essentially flat. In fact, at the end of 2020, the index closed at 6,460.52, lower than its 1999 value from over 20 years prior, although in 2021, the index has finally surpassed 7,000 again. This is not quite as bad as the Nikkei 225, but it doesn’t inspire much investor confidence either. The roaring bull market in the 80’s and 90’s is just a distant memory.
We know, of course, that the US market was also pummeled by the dot-com bubble and global financial crisis. But the US market recovered and surpassed its 1999 peak a long time ago. How does the FTSE 100 compare to the S&P 500 since year 2000?
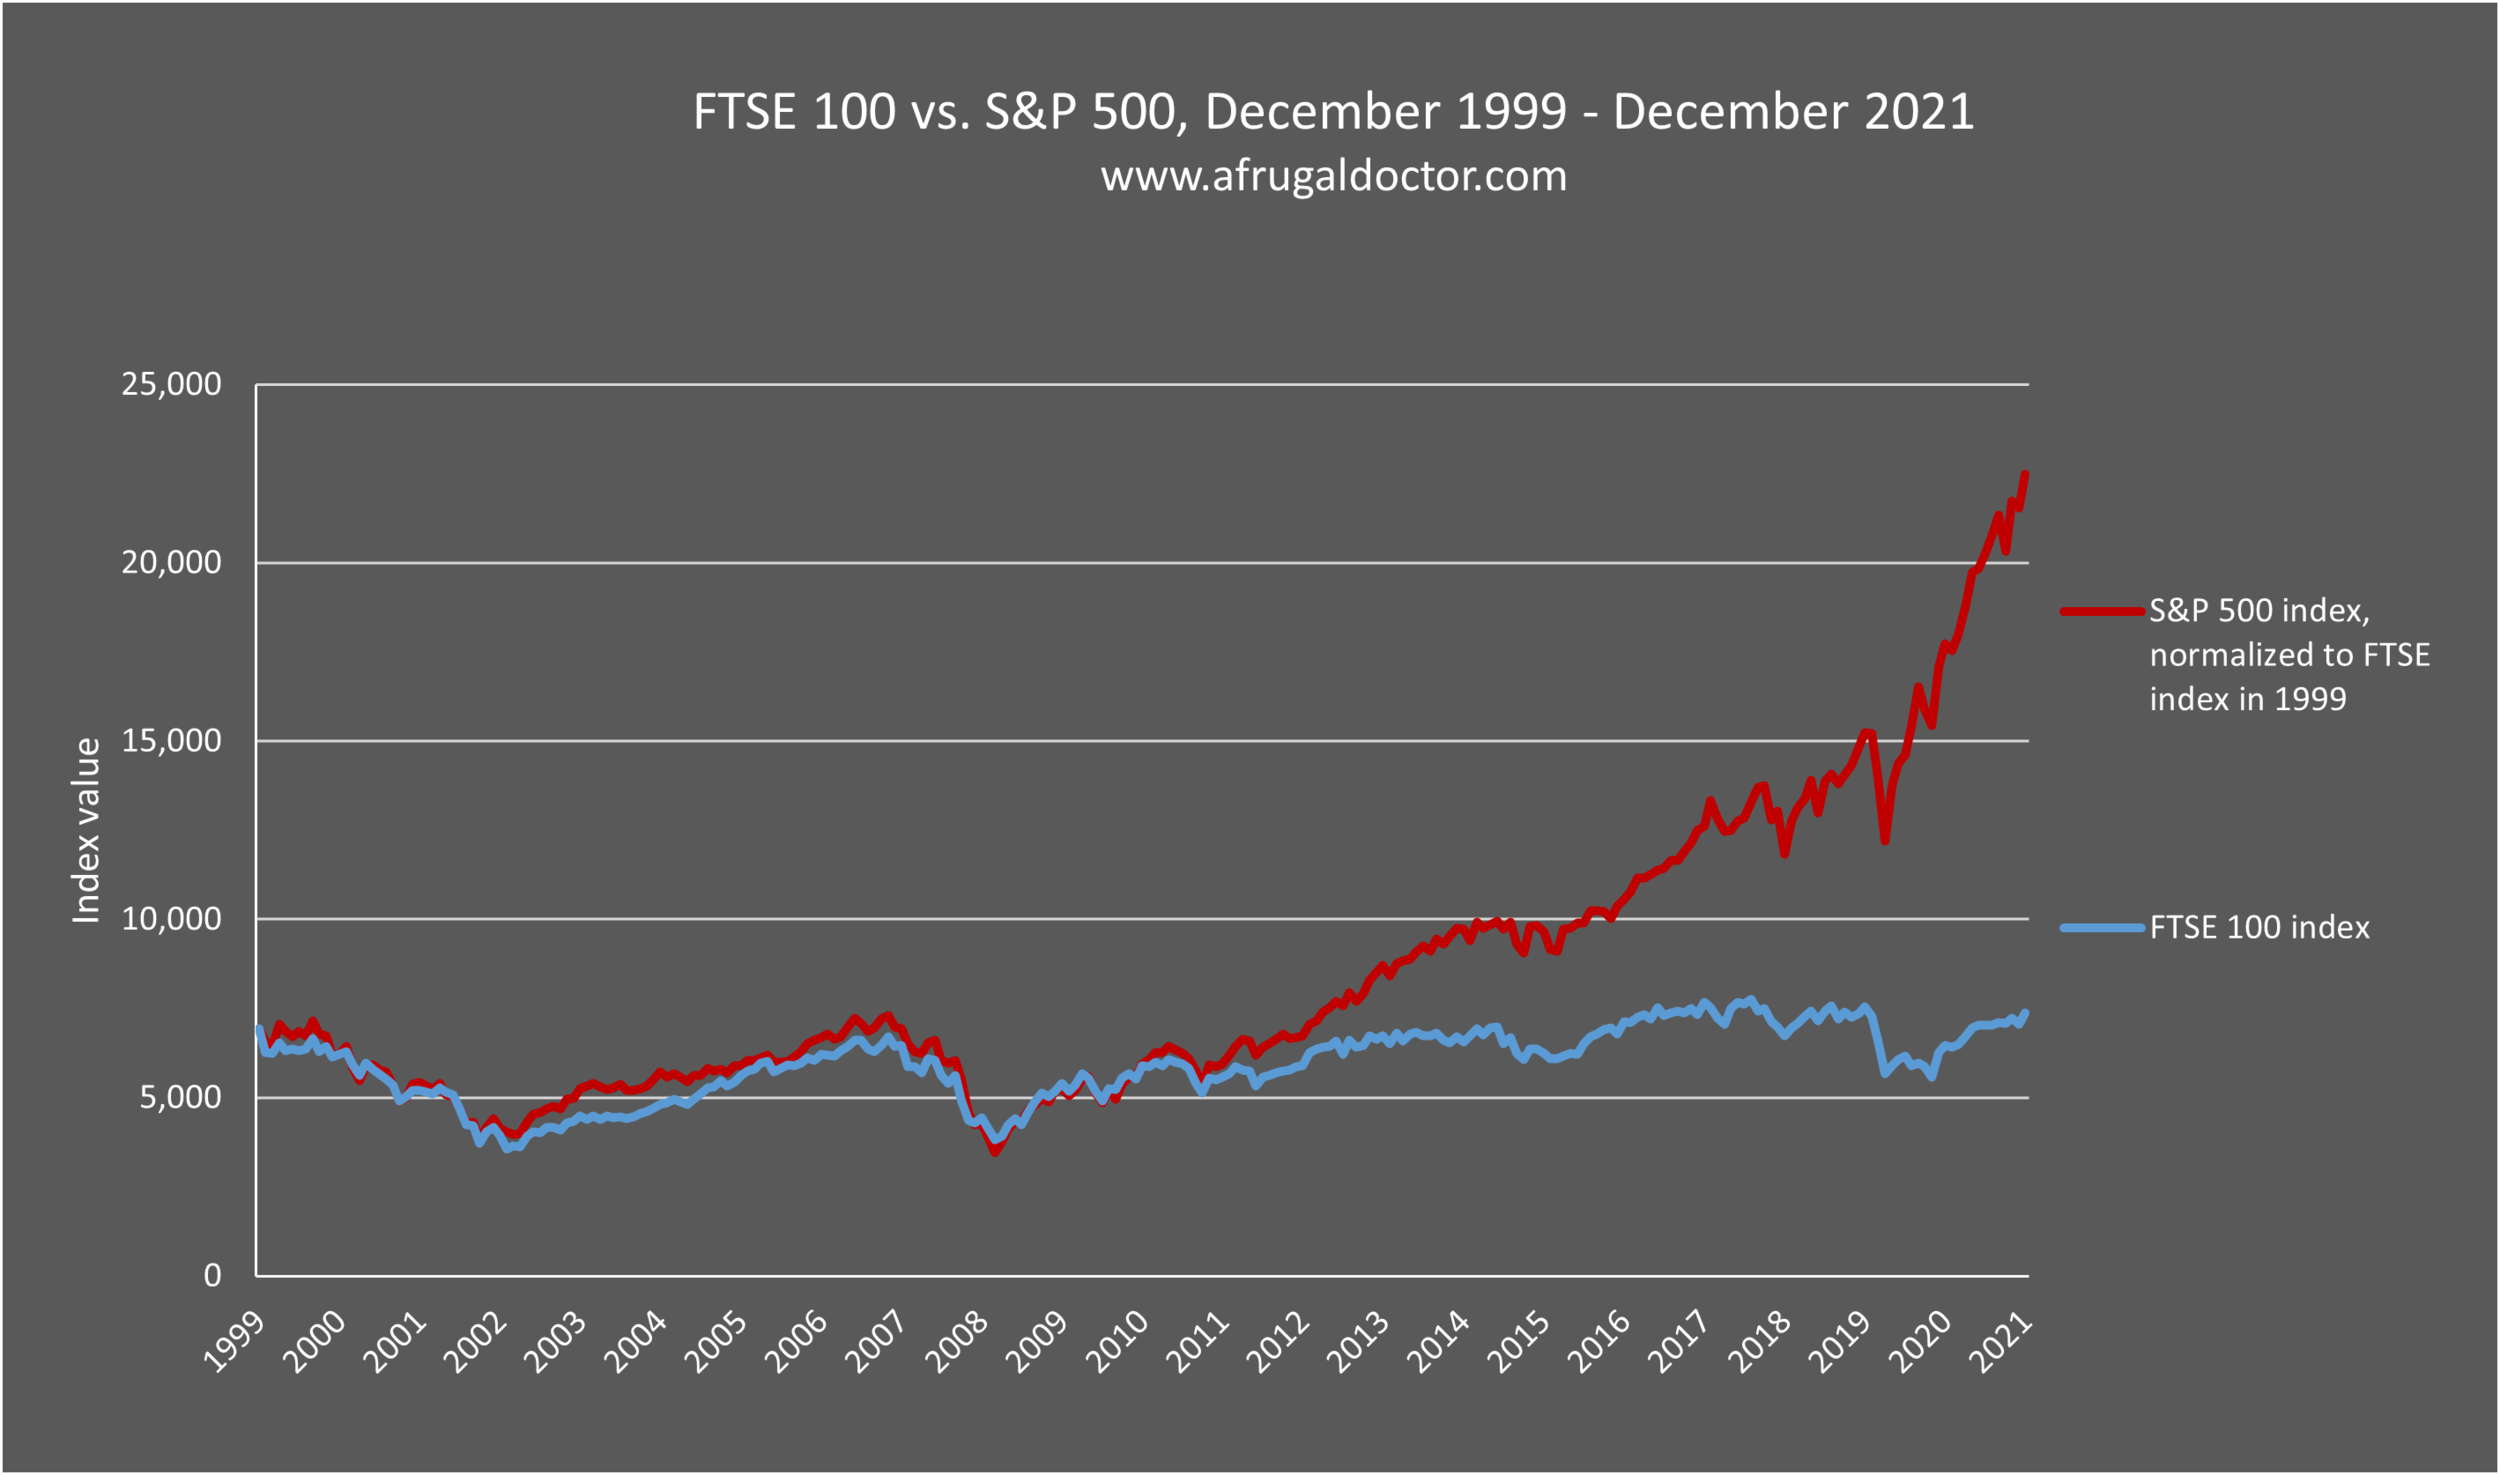
UK vs. US stocks since the dot-com bubble.
We see that the FTSE 100 actually followed a very similar trajectory to the S&P 500 in the decade since the dot-com bubble, up until 2010 or so. However, with no further market crashes, the US market subsequently went on an incredible bull run in the decade of the 2010’s, leaving most global equities and many other asset classes in the dust. For many younger investors, the S&P 500 after 2010 is the only kind of stock market returns that they’re familiar with, and the FTSE 100 certainly pales in comparison to the S&P 500 when it comes to recent performance.
So, have British investors just been twiddling their thumbs for the past 20 years, watching their investments return nothing while their overseas cousins are reaping outsized market gains? Not quite. While recent UK stock returns have lagged the US, British investors were not left out in the cold.
FTSE 100 total returns
As always, with any stock investment, we must take dividends into account and look at total returns, rather than just the change in stock or index price over time. Many FTSE 100 companies pay dividends, and while the dividend yield of the FTSE 100 fluctuates from year to year, it tends to be higher than the S&P 500 on average.
When we take dividend reinvestment into account and look at FTSE 100 total returns, we can see that the FTSE 100 has provided positive returns to British investors despite staying flat for 20 years.

FTSE 100 total returns (with dividend reinvestment)
Over the past 22 years, the FTSE 100 has returned 135.4% in total to investors, even when we start the calculations at its December 1999 peak. This works out to annualized returns of 3.97%. Once again, the UK market shows the importance of dividend reinvestment, and the need to look at total returns rather than just the change in the stock or index price over time. I should also point out that if we start calculations from its inception in 1984, then the FTSE 100 has provided well over 2,000% in total returns, for annualized returns of slightly less than 9%. So, when we pick December 1999 as the starting point, we’re also picking the worst possible starting time to invest in the FTSE 100.
Conclusion
The FTSE 100, and by extension, the UK stock market, has provided positive returns to UK investors, despite remaining flat for the past 20 years. This remains the case even if you had the worst possible timing: a lump-sum investment into the FTSE 100 at it’s peak in December 1999. One major caveat is that the returns above are nominal (before inflation) returns, not real (inflation-adjusted) returns. The UK experienced similar inflation rates as the US during this time period, and real returns are lower than the nominal ones. Also, the FTSE 100 returns are in British pounds (GBP), not USD. The exchange rate between GBP and USD and other foreign currencies fluctuates significantly over time. Any foreign investor would need to take exchange rates into account to calculate overall returns in their native currency.
Should a US investor invest in the FTSE 100? While there are many benefits to diversification, investing in the FTSE 100 is a bit complicated. There are many ETFs that track the FTSE 100, such as the Vanguard FTSE 100 UCITS ETF (VUKE) and the iShares Core FTSE 100 UCITS ETF (ISF). However, these ETFs are not available on any US stock exchanges, and are only available in Europe. Currently, there are no FTSE 100 ETFs or index funds available on a US stock exchange or at a US brokerage.
In 2015, an ETF called the Recon Capital FTSE 100 ETF was briefly available on US exchanges before it closed in 2016. There are, however, some US index funds and ETFs which track British stocks (although not specifically the FTSE 100), such as the iShares MSCI United Kingdom ETF (EWU), which trades on the NYSE and is available to any US investor with a brokerage account. While foreign diversification is a good idea, US investors don’t necessarily need to focus on the FTSE 100, and can instead simply diversify by investing in European or international ETFs or index funds, which gives even more international exposure than the FTSE 100 itself provides. If you’re dead-set on investing in in the FTSE 100 from the US, however, you would need to open a foreign brokerage account and deal with foreign exchange rates.
I hope you enjoyed this brief look at the FTSE 100. As always, thanks for reading and happy investing!


Another year in the books